


Introduction
Occasionally, I check the lighthouse performance scores of my websites. I started checking performance, SEO, accessibility, and cache scores when I began offering web development services. My motivation was that I felt it was, at the least, necessary that I was aware of these metrics.
To my surprise, when I began using frameworks like Gatsby, the performance index of my websites doubled (sometimes increasing beyond that). I switched over a few sites to the framework, and it's my go-to framework for building sites now.
Consequently, because I use Gatsby and have seen the performance increases, I became lazy with some of my practices.
I was upset a couple of weeks ago when I ran the lighthouse test application in the Chrome DevTools and saw performance numbers in the 80s and low 90s. The websites I tested were not big applications. I told myself; they should be damn near a 100.
After making some performance, accessibility, and SEO changes in my code, my blog (retz.blog) saw a significant increase. Also, I found a couple of resources that made the optimization practice easier.
In this article, I implement the same changes, using the same tools to the homepage of my business site. I'll discuss the tools and changes that helped me quickly increase my scores across the board.
The site that is the focus of this article is built using Gatsby and deployed with Netlify. Therefore, most of the fixes may only apply to those technologies.
This article is not an exhaustive look at performance with every testing, metric, and environment caveat. Google Chrome Lighthouse is NOT the only performance metric that matters, and scores aren't always the same. Below are a few links that help add to the testing conversation.
Initial Analysis
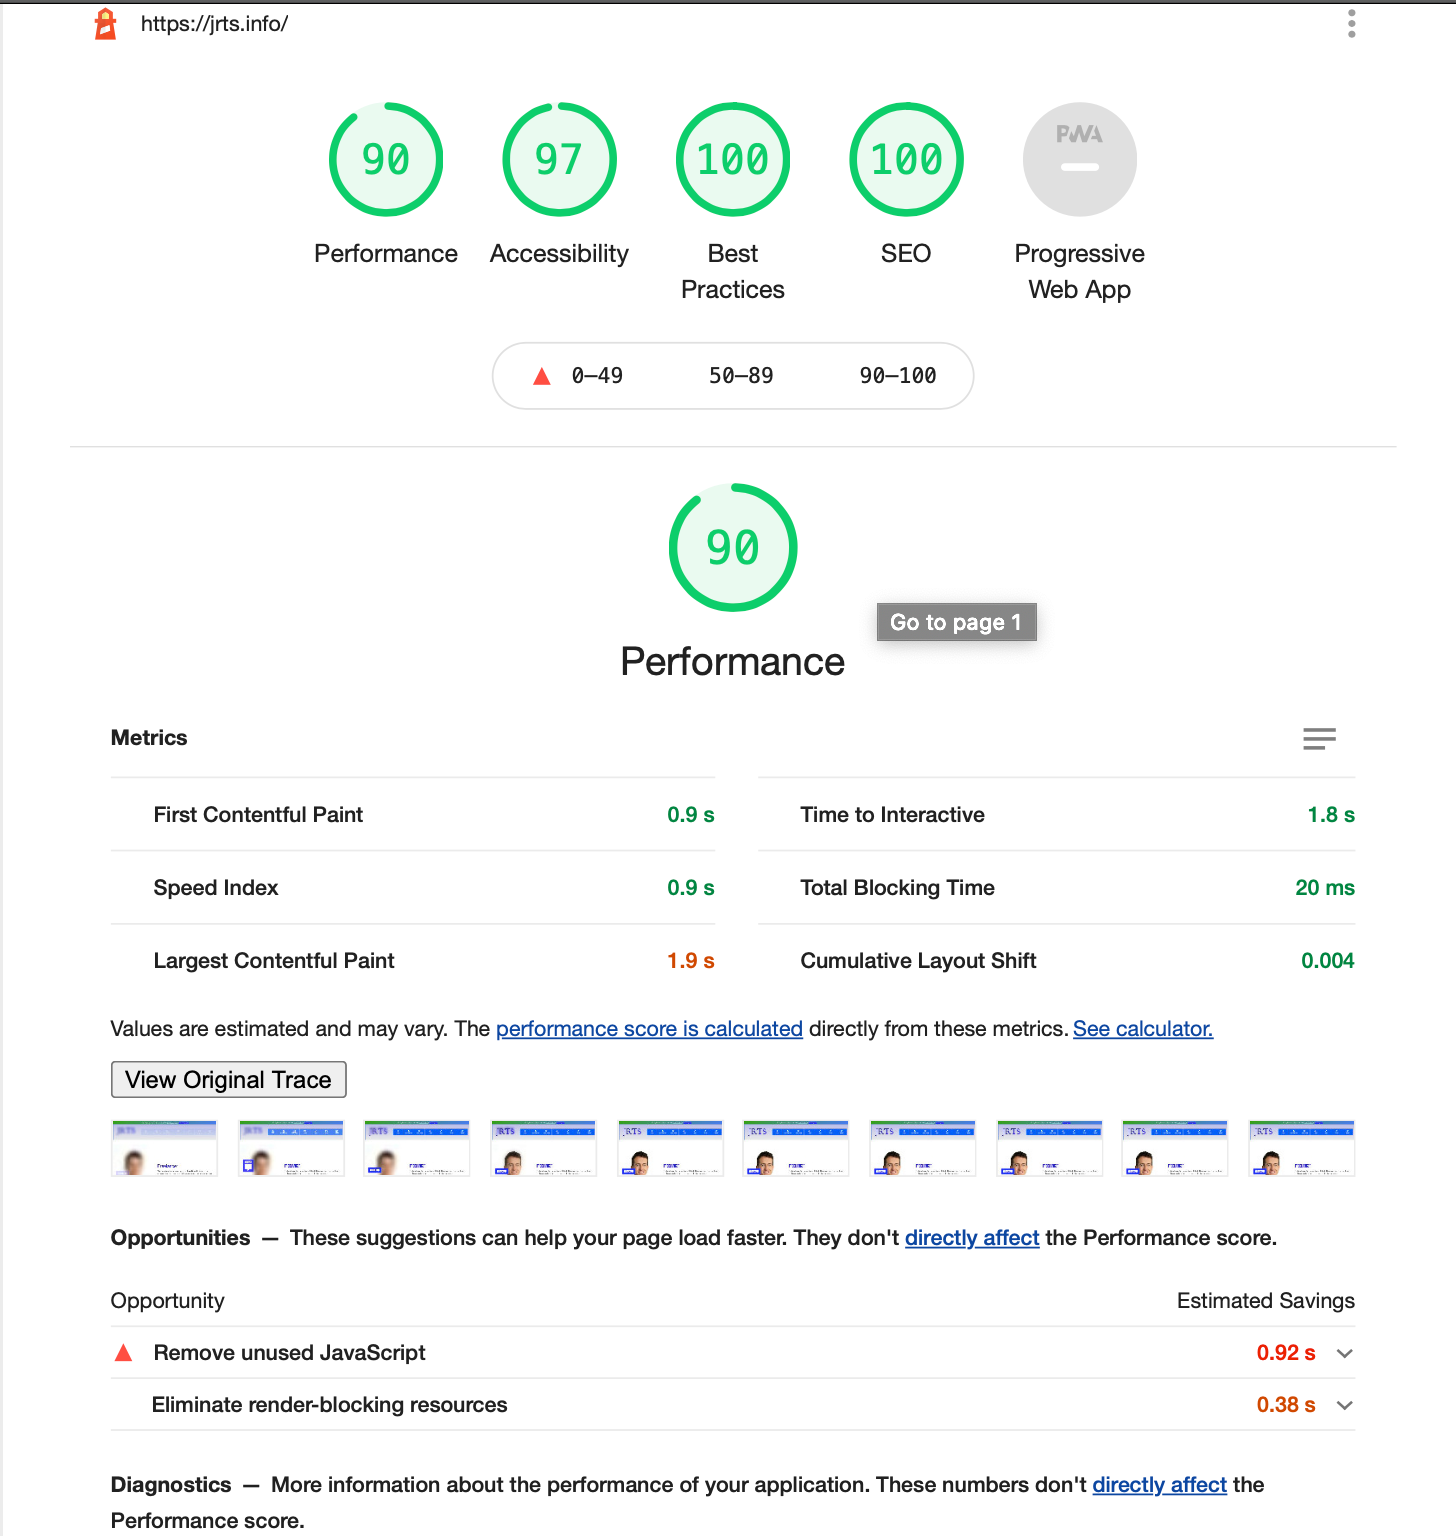
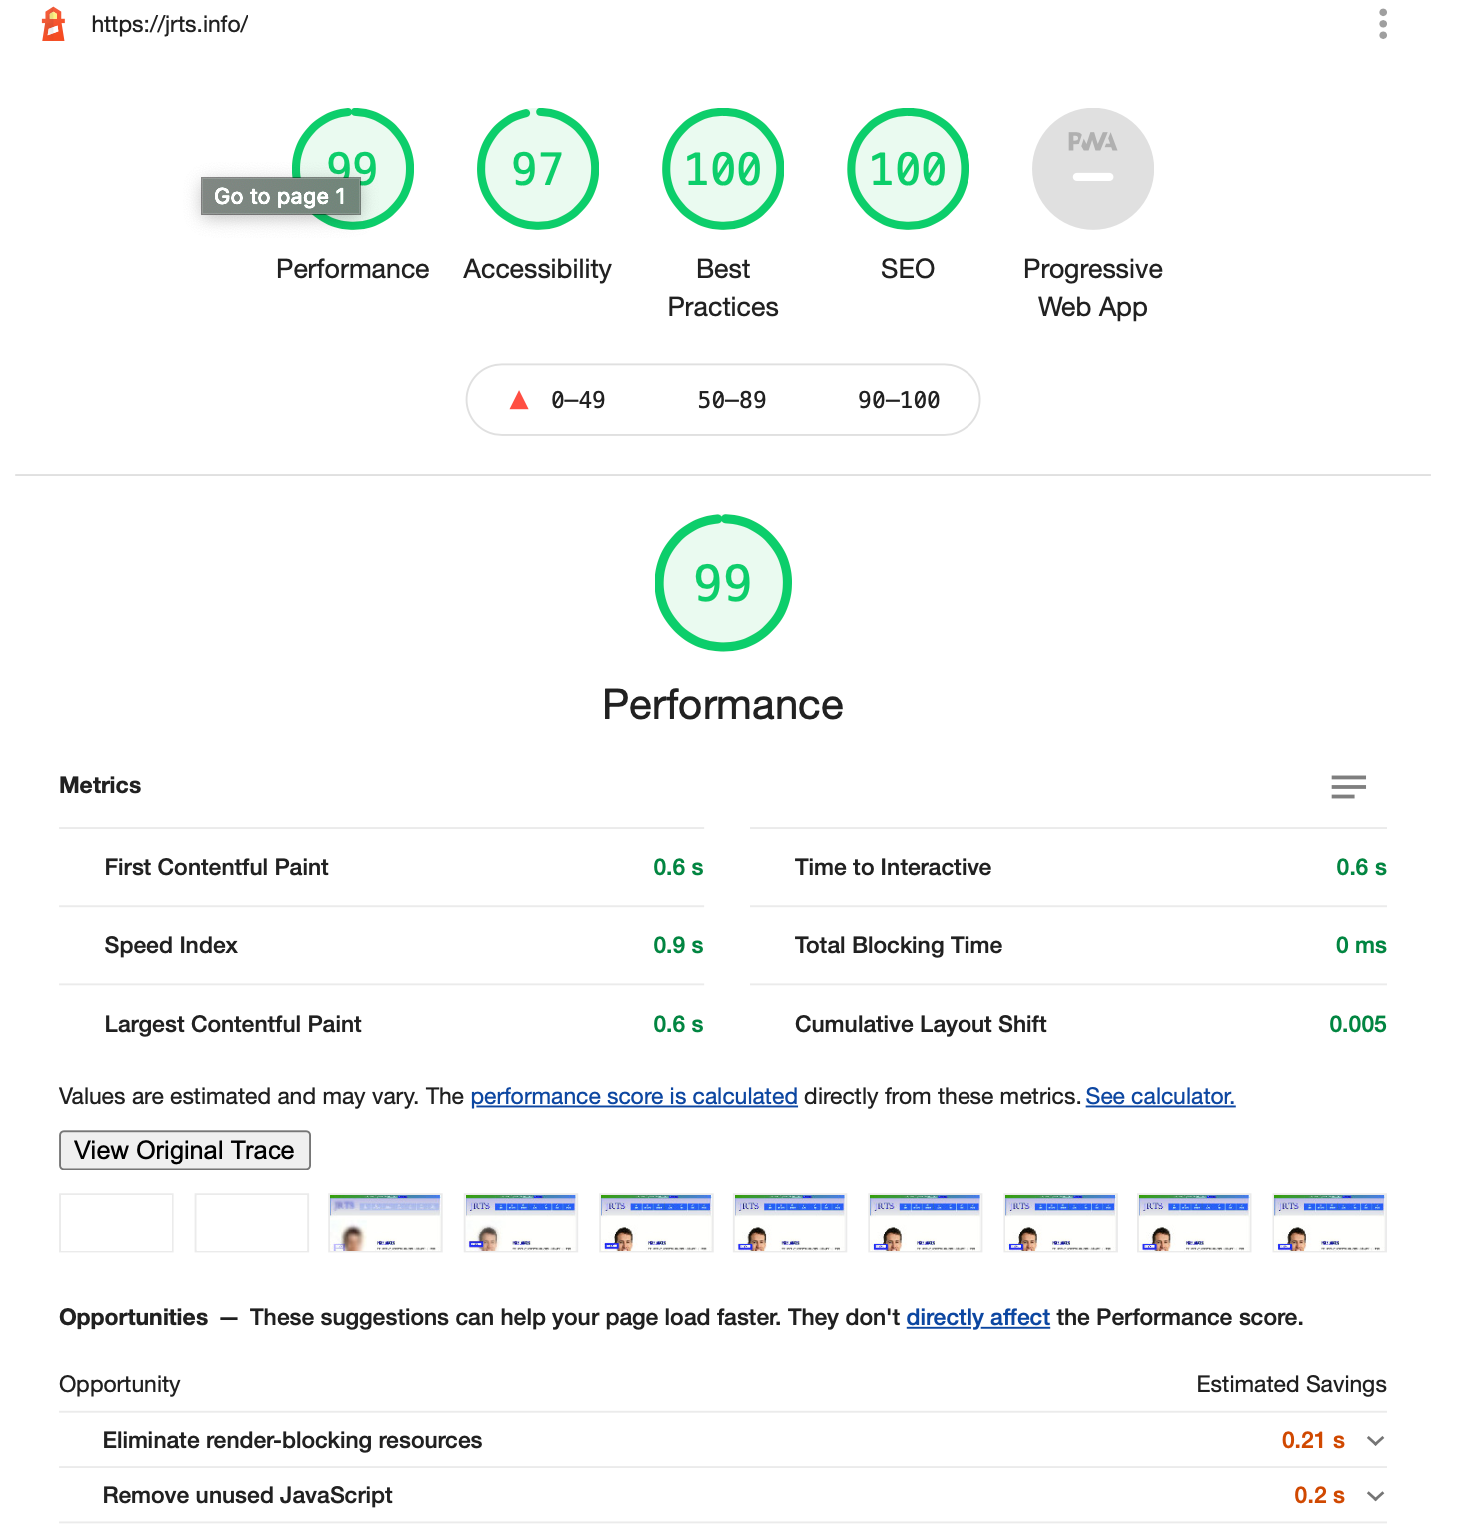
I performed the audit on the home page of my business site. Surprisingly, the score wasn't as bad as I thought it would be.
I noted that I had render-blocking resources, unused Javascript, and some image optimization to do.

I'm not going to go into depth about the small accessibility changes I made. I had some text below the contrast ratio threshold and a couple <h4> tags that were out of place.
Performance Optimizations
I made three performance optimizations that helped reduce the impact of my largest contentful paint, unused Javascript, and render-blocking resources.
gatsby-plugin-image
In Gatbsy v3, they changed the way that dynamic and static images are handled. I was already using the older gatsby-image plugin, but some of my dynamic images did not set width properties. Other images weren't even using the image optimizing components.
I switched all of my images, and the site, to the latest components and packages. This was not an everyday task. It required some work.
Fortunately, the page (linked to in the section heading) is beneficial.
Still, people may struggle to define a width for a dynamic image in the Gatsby GraphQL query. What helped me find maximum widths properties is constraining the <main> tag across my sites.
The maximum width that the container components can be is 1440px, which I think I got from the Bootstrap library. This constraint gave every image a maximum width.
Not surprisingly (because I'm rending a giant image of myself above the fold), this optimization caused a big jump in my performance score.

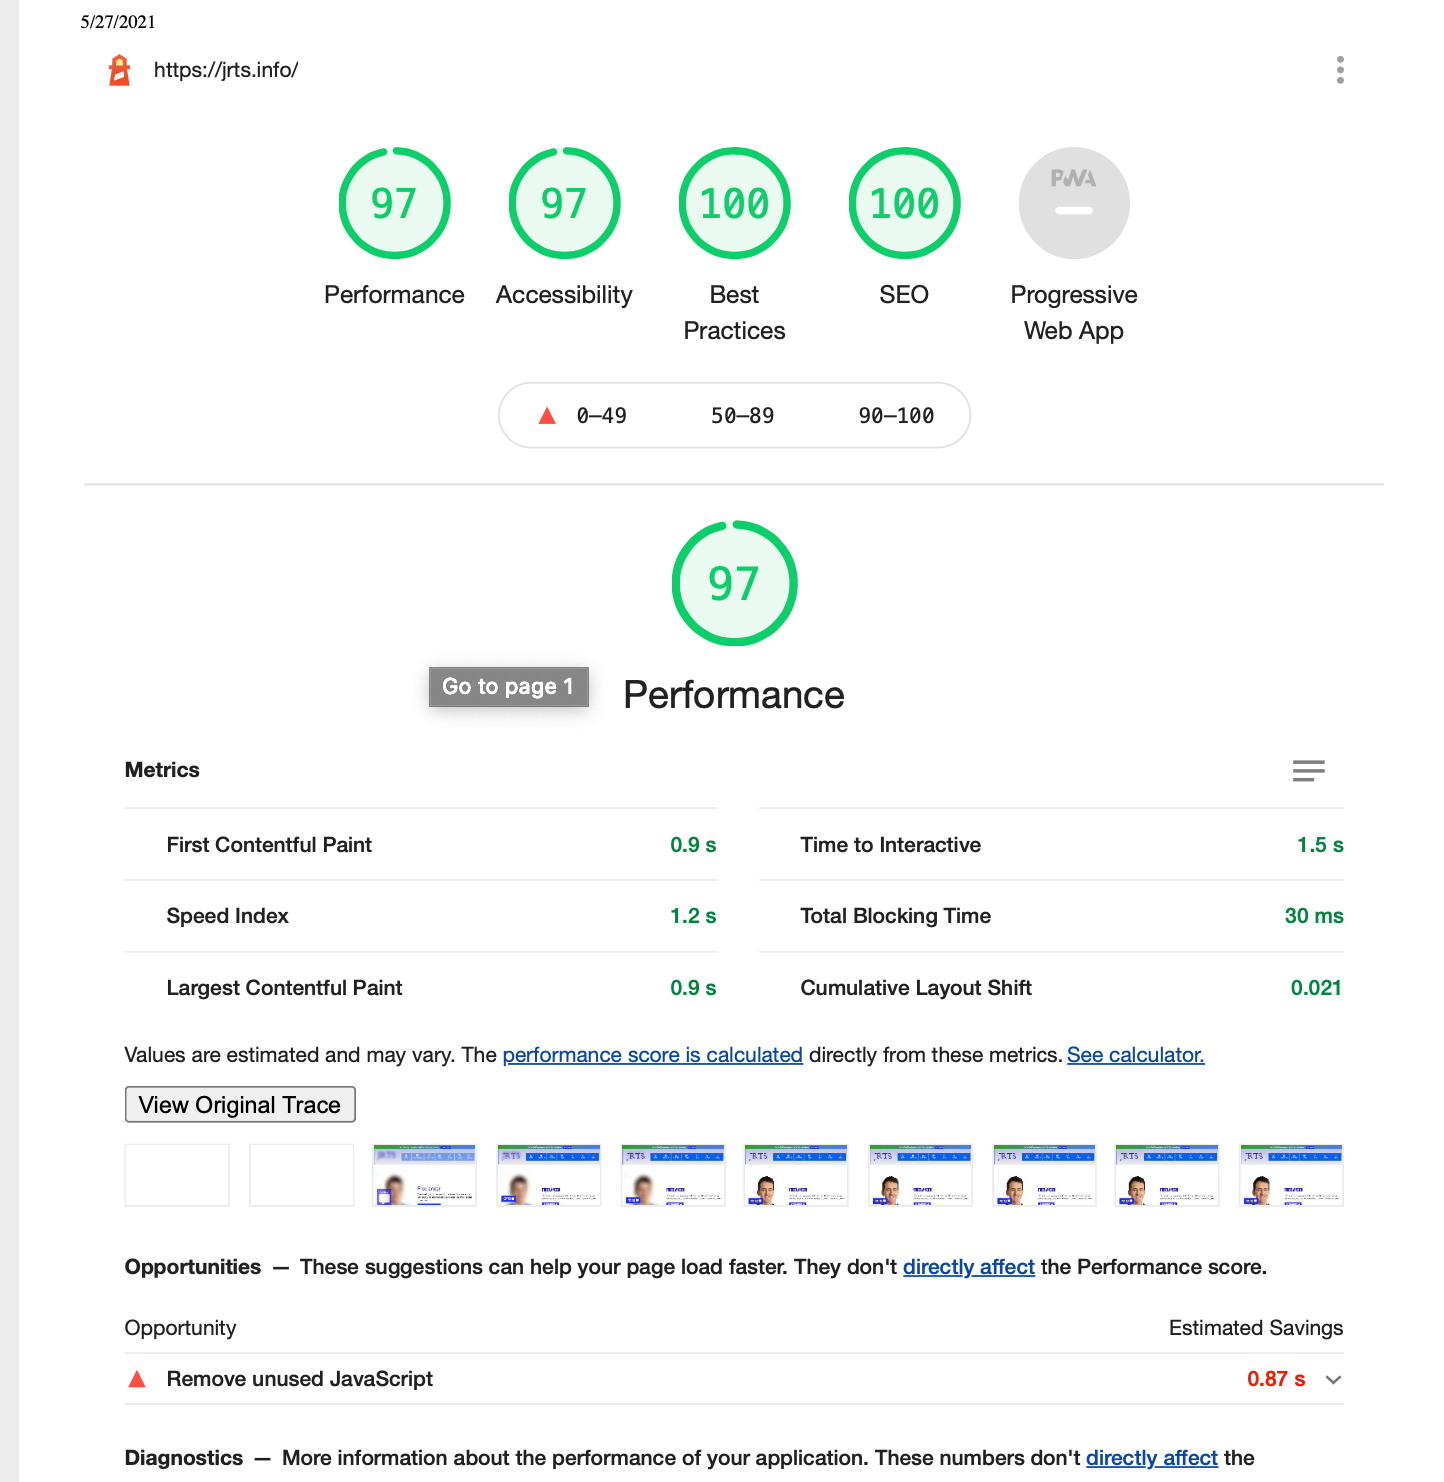
Setting maximum width properties on the two images rendered on the audit page (logo and picture of me) made a massive difference in the Largest Contentful Paint.
gatsby-plugin-webpack-bundle-analyser-v2
After the image component conversion, I needed to tackle unused Javascript. Unfortunately, the compiled webpack file names are cryptic and not easy to identify.

Thankfully, there is a splendid little plugin called named gatsby-plugin-webpack-bundle-analyser-v2. When added to a Gatsby project, the plugin helps you analyze your bundle by module and scales each library inside each module (file) proportional to its size. I'll include pictures below, but imagine a map with circles representing different cities, and each cities' circle is proportional to its population. That's the concept behind the analyzer tool.
First, to install the plugin, add it with NPM.
npm i gatsby-plugin-webpack-bundle-analyser-v2 -D
Then, add the plugin with options to your gatsby-config.js file.
{
  resolve: `gatsby-plugin-webpack-bundle-analyser-v2`,
  options: {
    devMode: true
  }
}
Set devMode to true, and the plugin will fire up a foam map of your webpack bundle tree on port 3001 when you start your app.
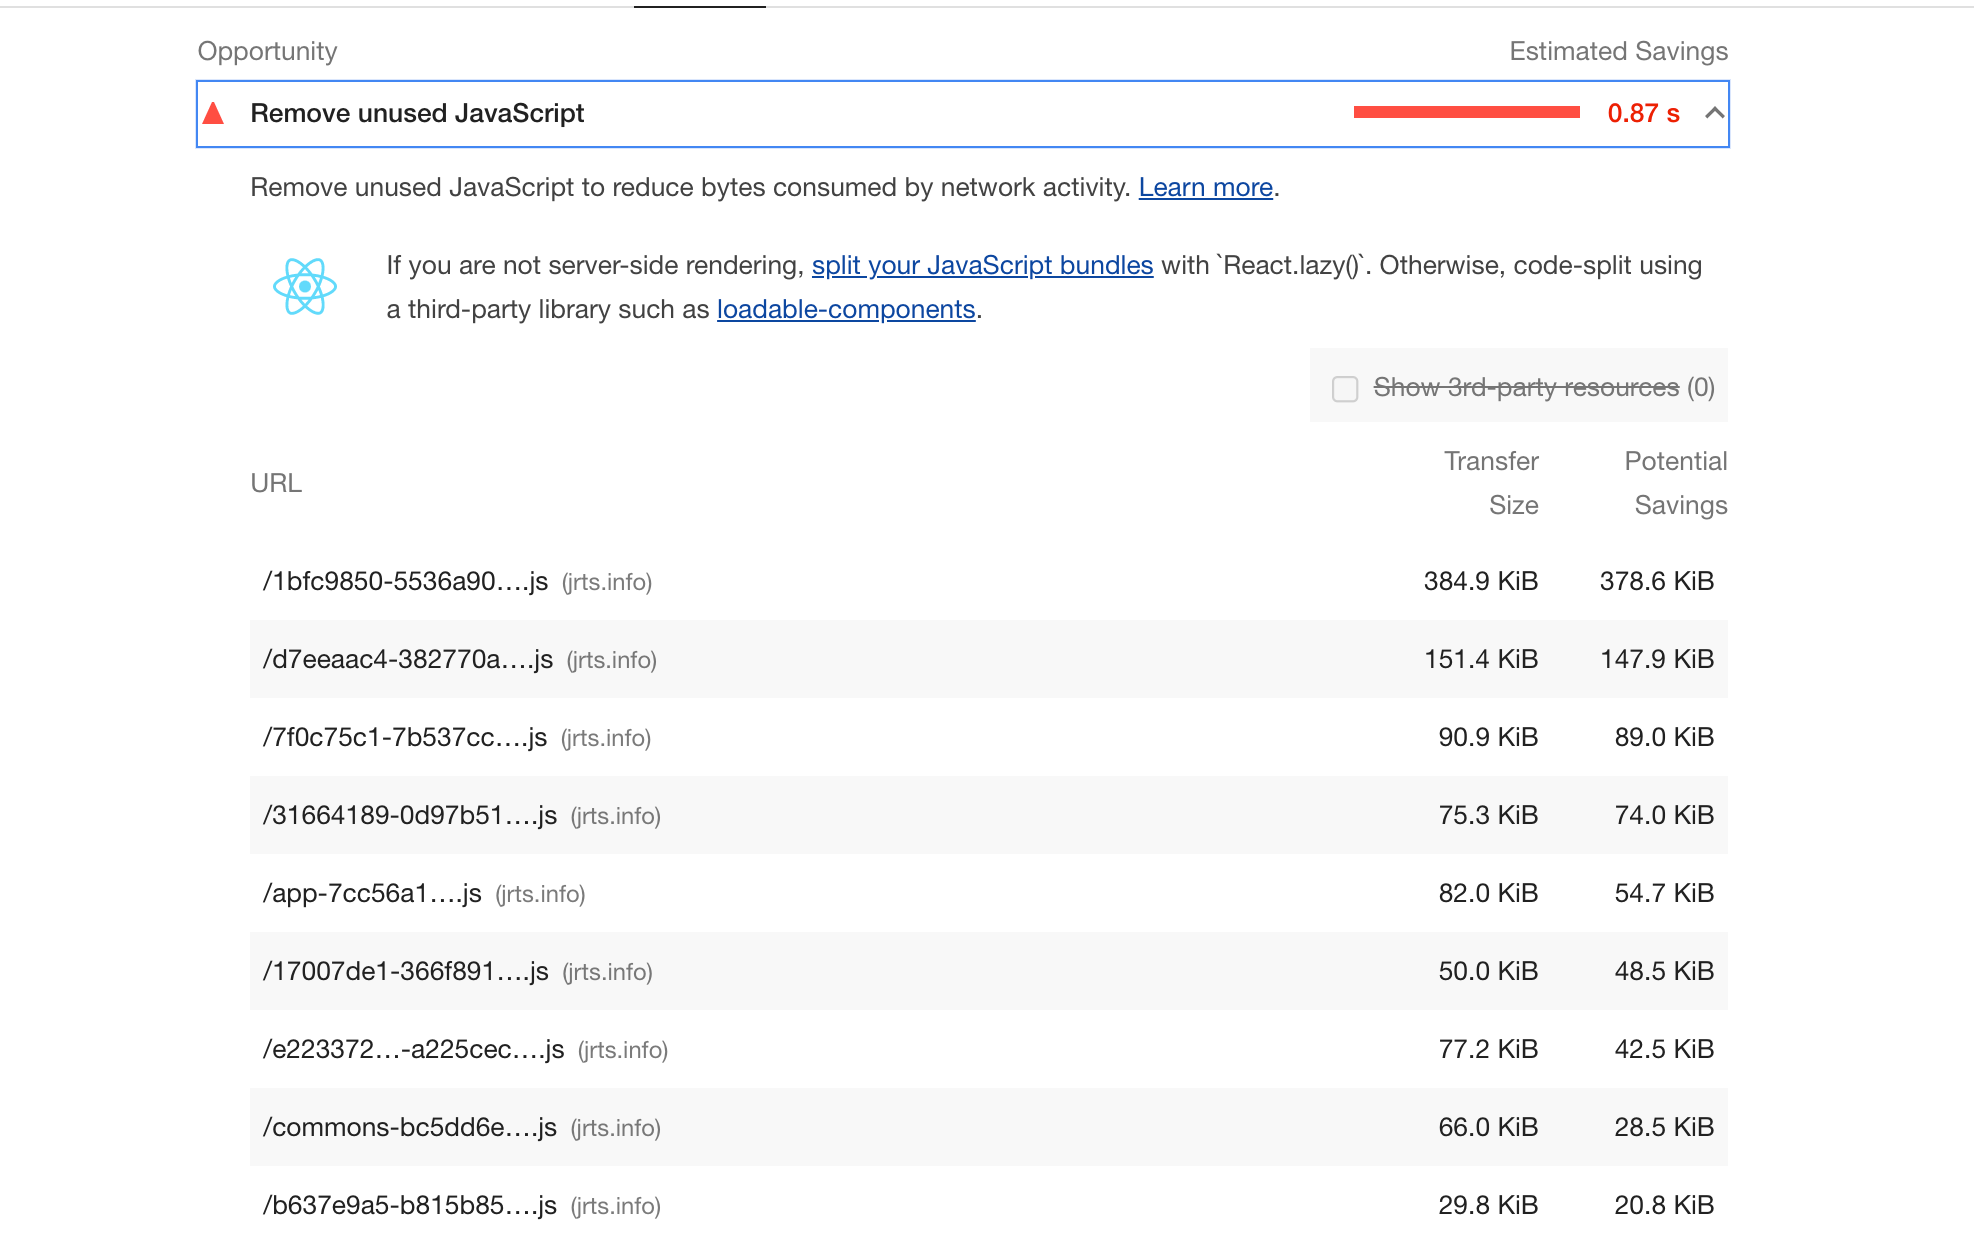
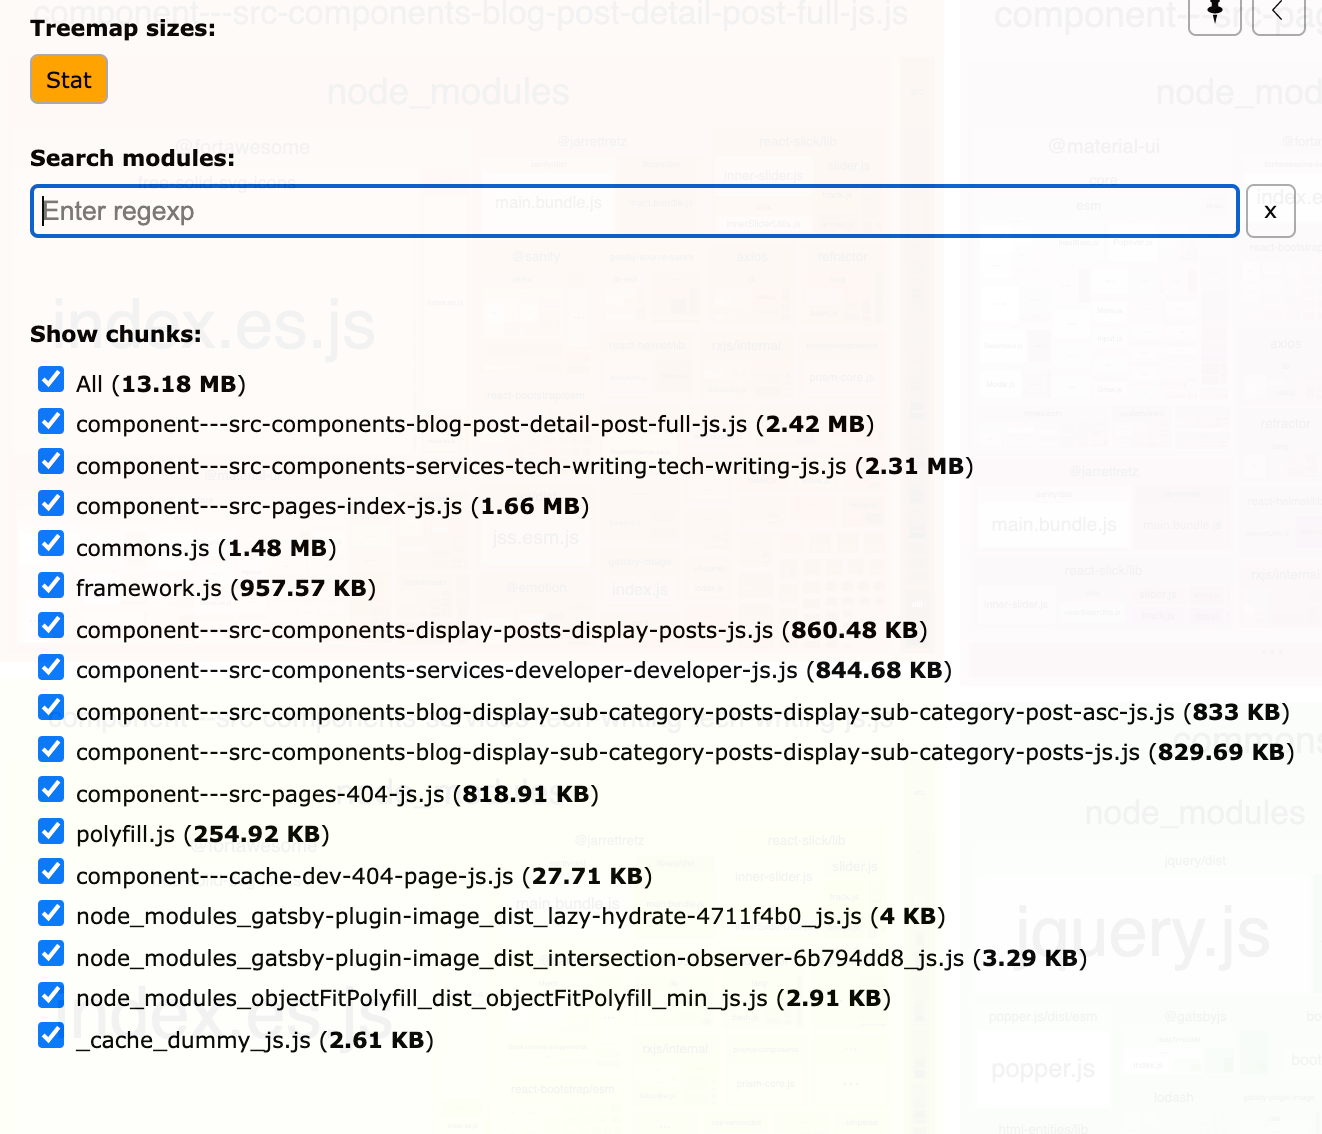
For example, lighthouse gave me a list of unused Javascript files for my index page. It doesn't tell me the percentage of Javascript used in each file (I would have to use the dev tools Coverage tool for that), but I can assume that if there is a huge file, I'm not using all the code in it.
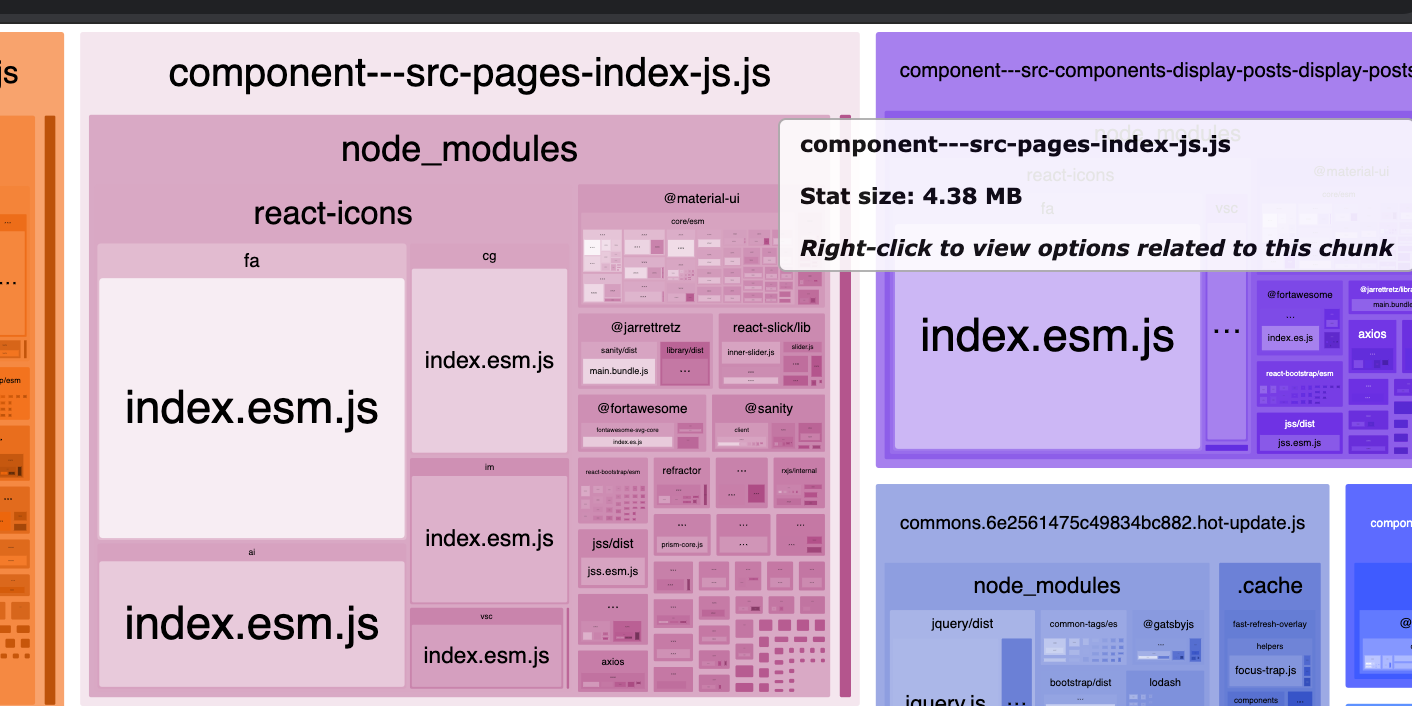
The webpack analysis plugin shows me that I have a few large packages taking up real estate in my index file.

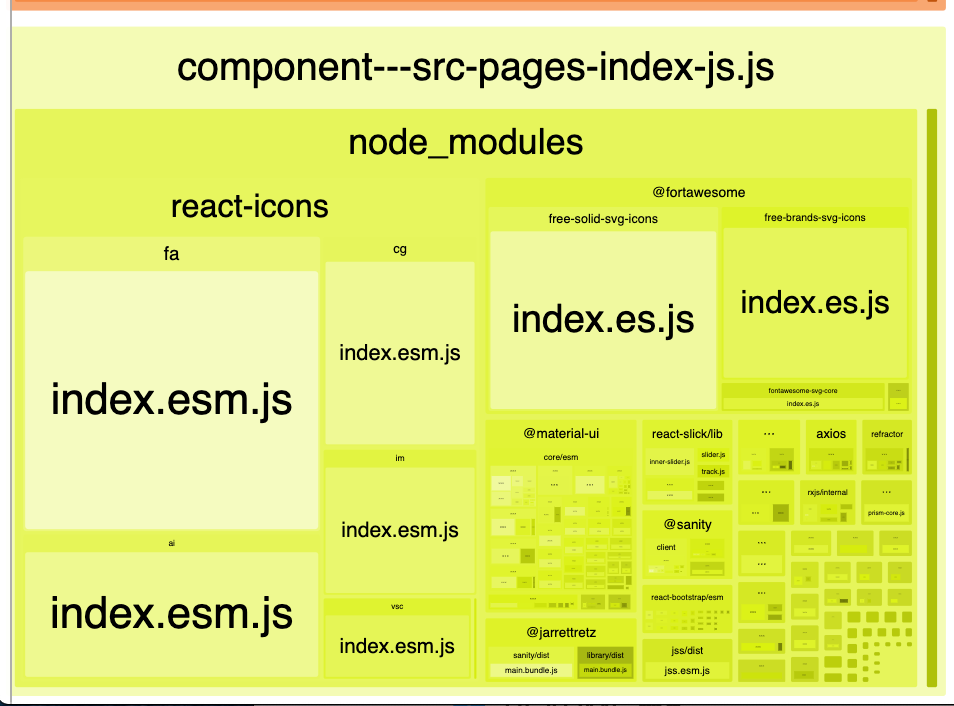
react-icons and @fortawesome are SVG icon libraries. It's doubtful that I'm using all the icons on every page, or even a majority of the icons. Something is wrong with the code.
Tree Shaking
Tree shaking is a term commonly used in the JavaScript context for dead-code elimination. It relies on the static structure of ES2015 module syntax, i.e.importandexport.
Webpack documentation
I don't fully understand tree shaking. However, I know that I wasn't allowing webpack to "tree shake" these icon packages.
For example, in my index file, I was importing navigation bar icons from the free-solid-svg-icons module.
import { faBars } from '@fortawesome/free-solid-svg-icons';
However, this was pulling in all kinds of different icons, when I only needed a handful. Instead, I should have been importing icons from the specific module.
import { faBars } from '@fortawesome/free-solid-svg-icons/faBars'
Notice, now the import statement is scoped deeper down into the faBars module.
After making this correction for all the modules connected to the index file, the @fortawesome square has shrunk down to a reasonable size in the webpack analyzer foam map.
Color has changed, but it's the same module.

I know now that webpack can trim off the unused code from that library. However, the file is still bloated due to the react-icons library. Furthermore, the entire bundle is relatively big given the amount of content that is on the site.

The react-icons library was imported all over the place, and it was evident that I needed to tame it in the application.
I tried using the same import syntax for react-icons, but obviously, not all libraries are the same. I wasn't able to import just the icon I needed, despite using named imports. The rest of the library was pulled into each module.
*Fast forward through a lot of code changes and internet search*—I removed react-icons from my project, replacing the icons with:
-
@fortawesome/free-solid-svg-icons @material-ui/icons
Both libraries allow you to pinpoint imports and enable webpack to tree shake.
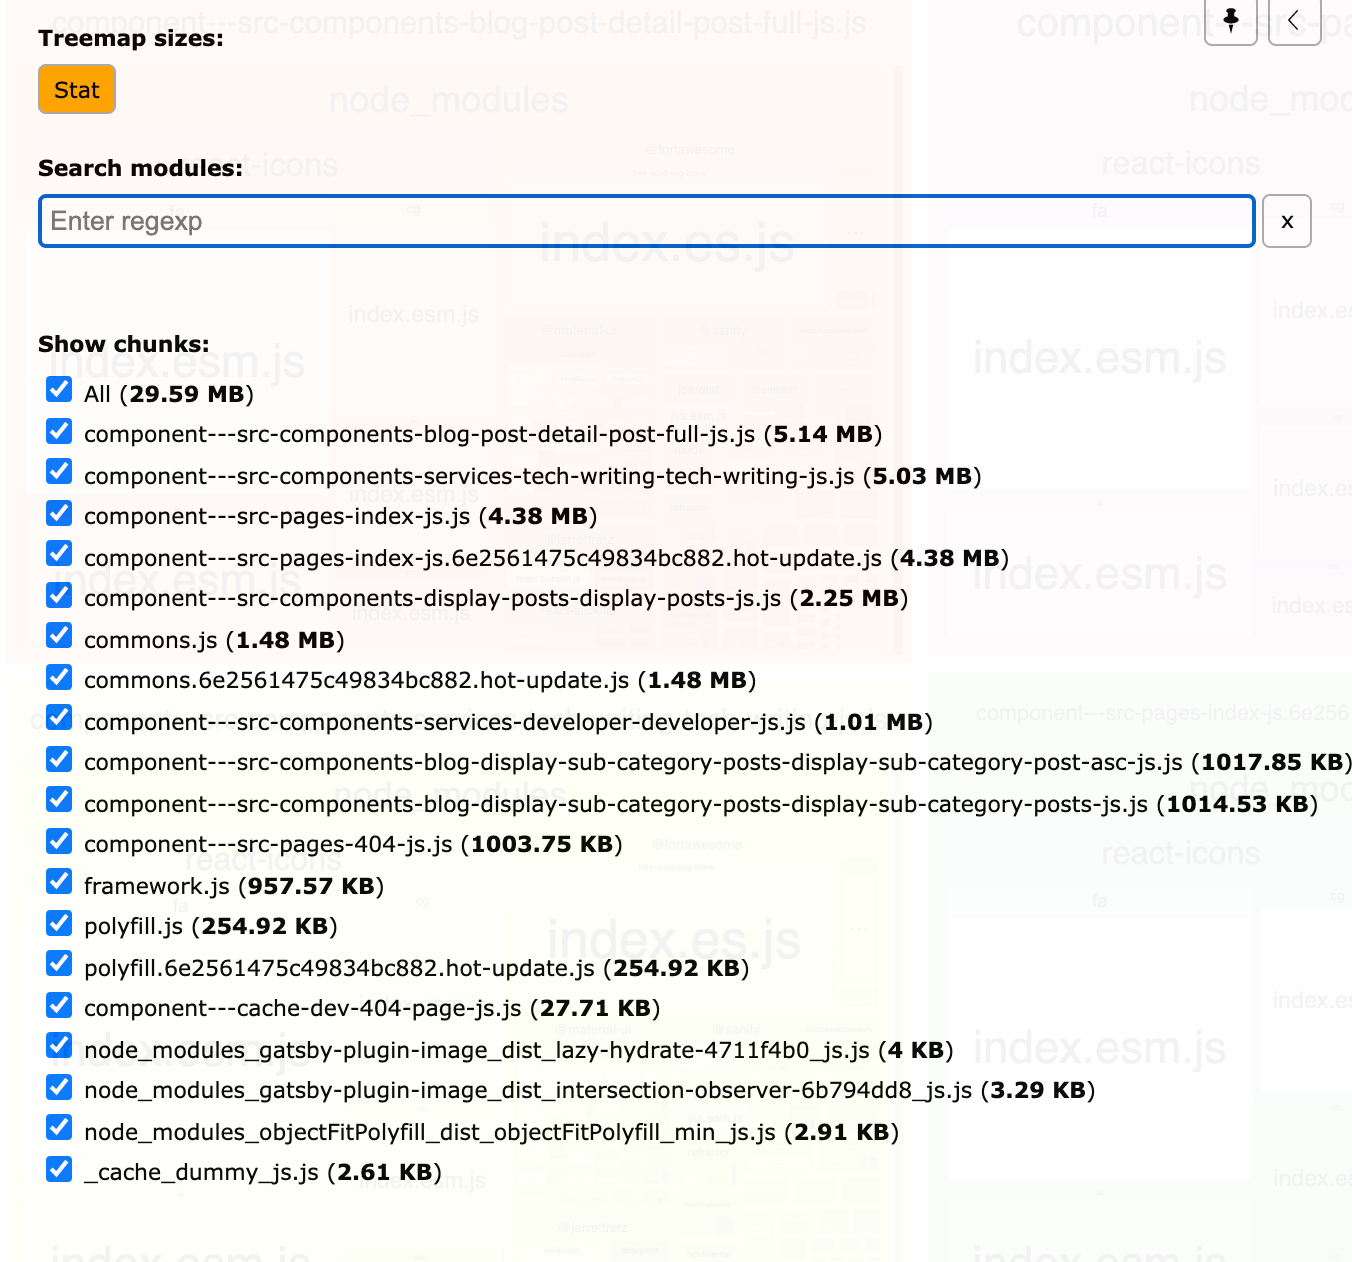
This made a huge difference.
After removing react-icons, I cut my bundle size in half. It dropped from 29 MB to 13 MB

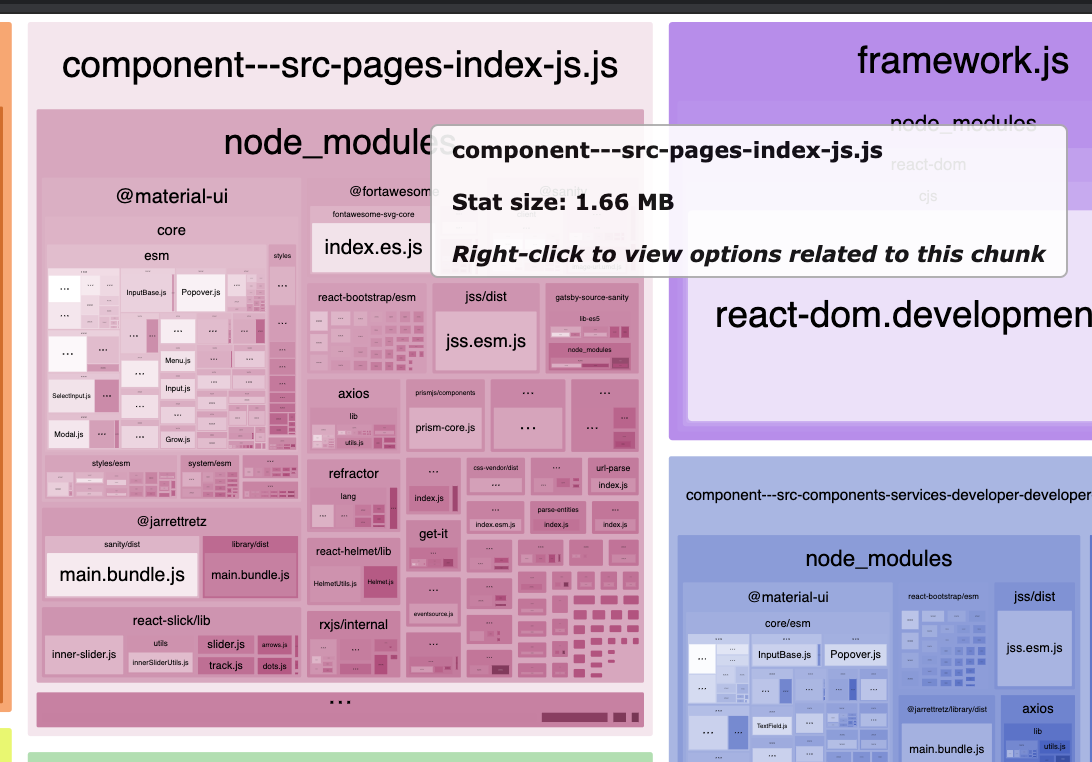
Taking a second look at the analyzer for the index module, there were no hidden giants like before.

I pushed the icon and import changes up to production and had confidence that I would see an improvement in my lighthouse score.

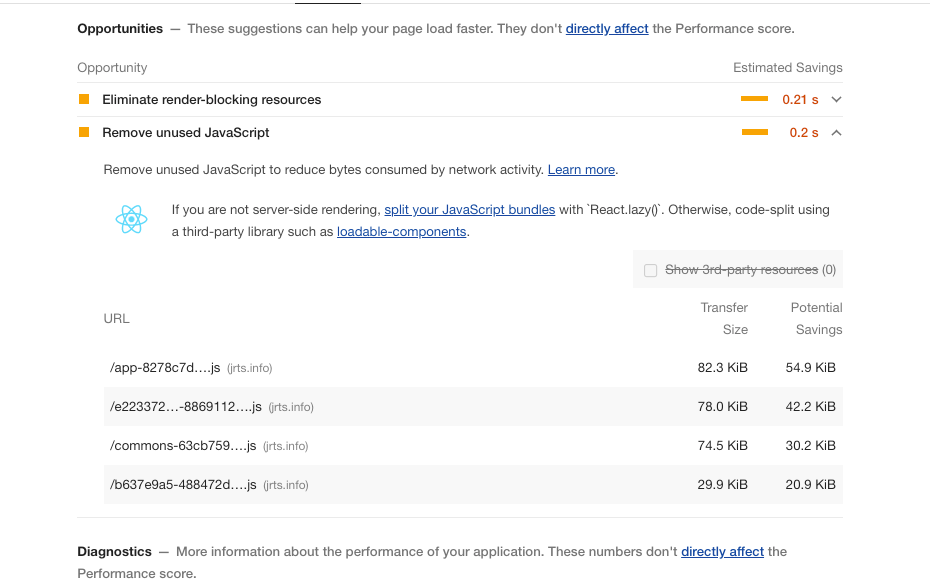
The estimated savings for Remove unused Javascript dropped from 0.87 seconds down to 0.2 seconds, and performance was up two points.
Also, the list of unused files was significantly reduced.

The final optimization was to look at the Eliminate render-blocking resources tab.
Eliminate Render Blocking Google Fonts
The only resource that was blocking the page was google fonts. I used a Gatsby plugin to import the fonts, but I was still getting this resource listed as render-blocking. Not surprisingly, this was common on the internet.
Just about everything I did next to remedy this came from an article on CSS Tricks:
How to Load Fonts in a Way That Fights FOUT and Makes Lighthouse Happy
The only different part, for me, was the Gatsby implementation. I took the same HTML tags in the article but put them inside a <LoadFont> component. Then, wrapped the tags using react-helmet to inject them into the head of each HTML page.
The <LoadFont> was similar to the code below.
import React from 'react';
import Helmet from 'react-helmet';

const LoadFont = () => (
    <Helmet>
      ...html tags from CSS tricks article
    </Helmet>
)

export default LoadFont;
Next, I imported this component into my main <Layout> component, so the fonts were accessible on every page.
import React from "react"
import PropTypes from "prop-types"
import { useStaticQuery, graphql } from "gatsby"
import Header from "./header"
import Footer from '../layout/Footer/Footer'
import LoadFont from "../LoadFonts/LoadFont"

const Layout = ({ children }) => {
  const data = useStaticQuery(graphql`
    query SiteTitleQuery {
      site {
        siteMetadata {
          title
        }
      }
    }
  `)

  return (
    <div className="App">
      <LoadFont />
      <Header siteTitle={data.site.siteMetadata.title} />
        <main>{children}</main>
      <Footer />
    </div>
  )
}

export default Layout
FOUT stands for Flash of Unstyled Text. I didn't quite get this figured out yet. But the article I linked to covers how to fix this, I think.
I implemented my new Google font loading component, then corrected a couple of accessibility flags. After pushing the changes to production, I opened up a new incognito tab (not running lighthouse in incognito can negatively affect the results) and reran the lighthouse audit.

Wow, fireworks and all.
Conclusion
Each application is different, blah, blah, blah—bottom line—if you're using Gatsby, the methods and tools mentioned above can you help you keep your performance tight.