Introduction
I've used Maps3D for years now to help me plan and execute backpacking trips or day hikes. However, it wasn't until recently that I discovered the ability to send myself the GPX files from recorded tracks or planned tracks.
This lets users share tracks (trails, routes, etc.), but it also made me curious about what I could do with the data.
Long story short, I found a reputable Python library named gpx_converter that can take a GPX file and spit out a Pandas data frame. This was almost too perfect and exactly what I wanted.
After converting the GPX file to a data frame, I followed the Plotly docs to add the data points onto a Mapbox satellite image.
This article is a quick look at the code that I used.
This won't be an introduction to Jupyter Notebooks, virtual environments, or using Python. So, if that's all-new there is no shortage of helpful material online.
Steps
Each code block will represent a single code block in a Jupyter Notebook. That's how I set it up, but you could, theoretically, put it all in one cell.
1. Import modules
import plotly.express as px
import numpy as np
import pandas as pd
from gpx_converter import Converter
2. Convert local GPX file to Dataframe
wonderland = Converter(input_file='olallie_to_indian_bar.gpx').gpx_to_dataframe()wonderland3. Format Data
I only wanted the time (not the date) from the timestamp. Also, the timestamp was GMT and not PST. Similarly, the altitude was in meters, so I converted it to feet.
# Convert GMT to PST and format
wonderland.time = wonderland.time.apply(lambda x: x.tz_convert('US/Pacific'))
wonderland.time = wonderland.time.dt.strftime('%I:%M %p')
wonderland.head(5)
# Convert altitude from meters to feet
wonderland["alt_ft"] = round(wonderland.altitude * 3.280839895)
wonderland["alt_ft"] = wonderland.alt_ft.astype('int')
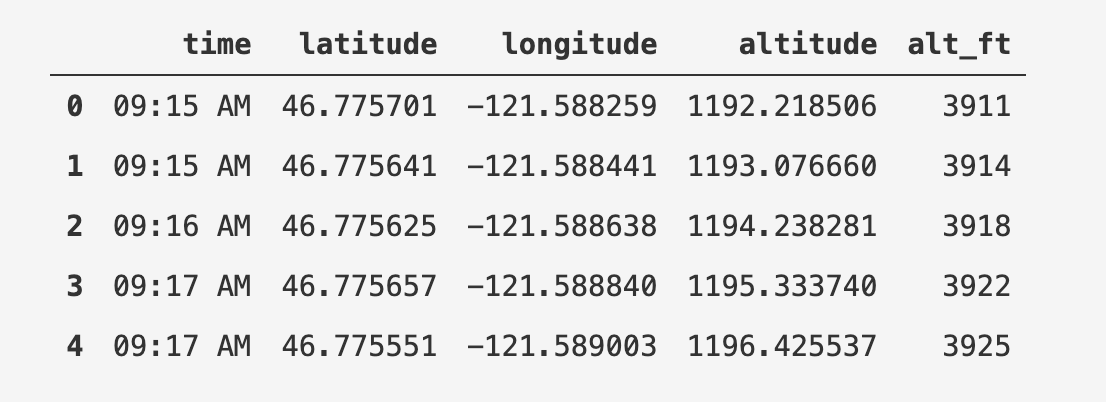
wonderland.head(5)After those transformations, the data frame should look like the image below.

4. Build Map
The majority of the code in this cell came from the Plotly docs on:
fig = px.scatter_mapbox(
    wonderland,
    lat="latitude",
    lon="longitude",
    hover_name="time",
    hover_data={
        "latitude": ":.2f",
        "longitude": ":.2f",
        "alt_ft": ":, ft"
    },
    zoom=11,
    height=500,
)

fig.update_layout(
    margin=dict(r=0, t=0, l=0, b=0),
    mapbox_style="white-bg",
    mapbox_layers=[
        {
            "below": 'traces',
            "sourcetype": "raster",
            "sourceattribution": "United States Geological Survey",
            "source": [
                "https://basemap.nationalmap.gov/arcgis/rest/services/USGSImageryOnly/MapServer/tile/{z}/{y}/{x}"
            ]
        }
      ])

fig.update_traces(hovertemplate='<b>%{hovertext}</b><br><br>(%{customdata[0]:.2f}, %{customdata[1]:.2f})<br>Elev. %{customdata[2]:} .ft<extra></extra>')

fig.show()
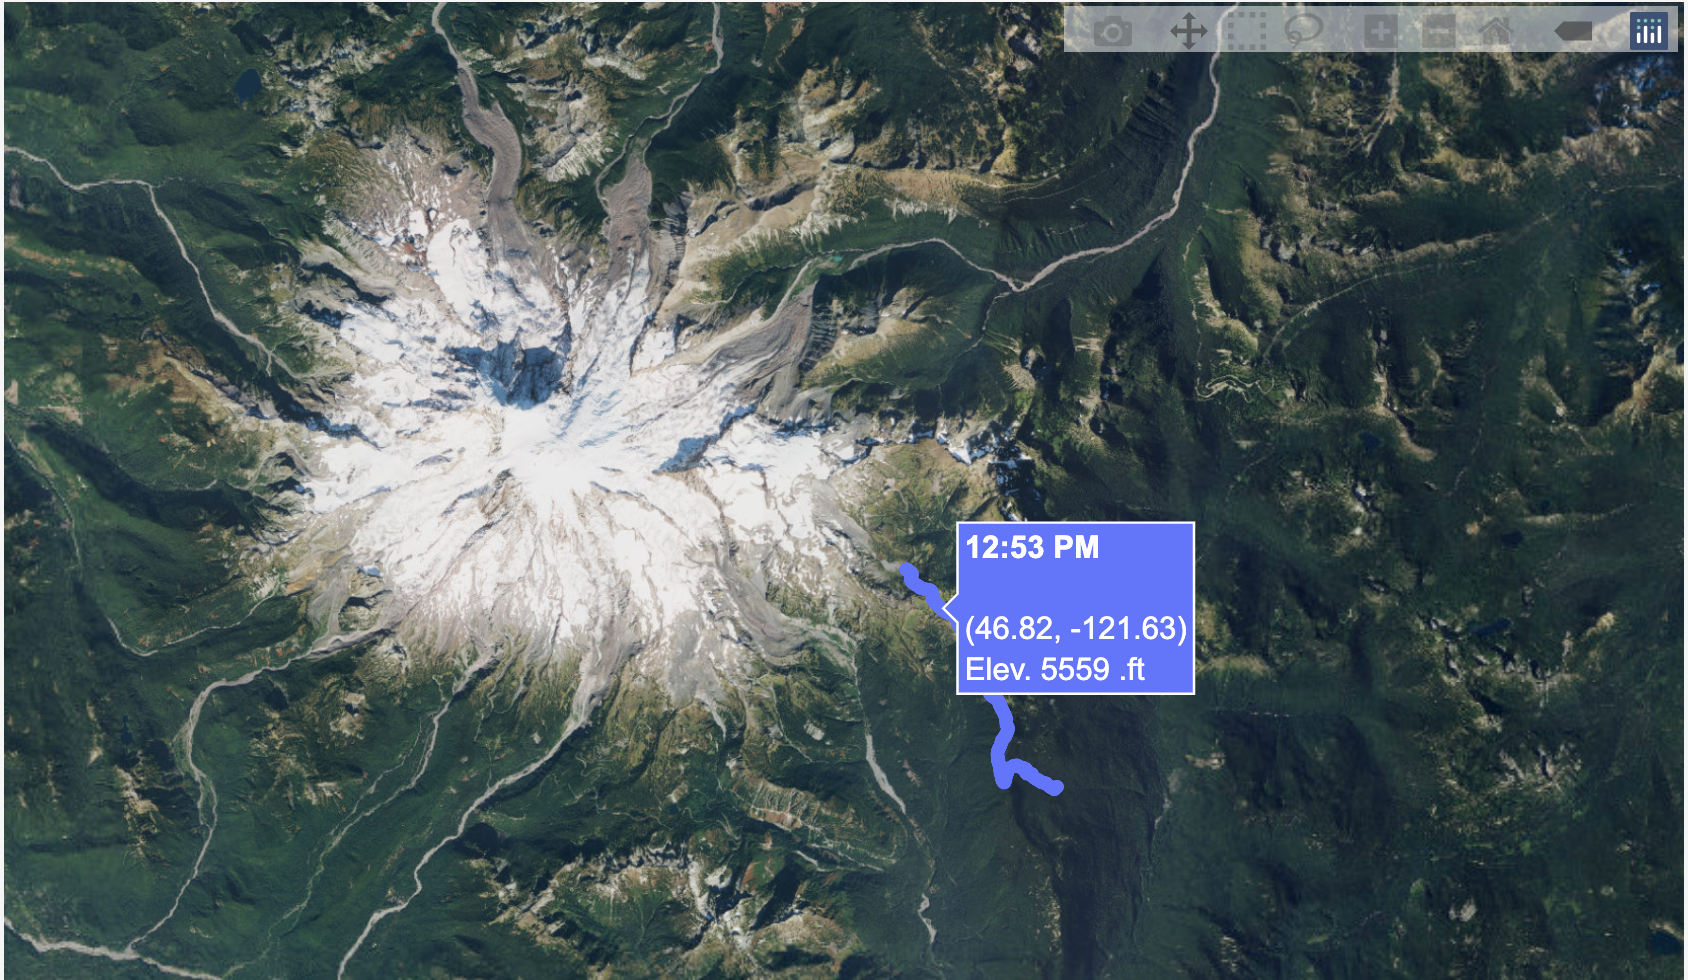
After running that cell, you will see the map with the plotted GPX data!

Thanks for reading!
You can check out the repository with the complete notebook code on Github.


