


- Part 1: Description of Report
- Part 2: Discussion of Classification Model Evaluation with Multi-label Data
PART ONE
I was doing a practice analysis with some personal data when I found myself digging deeper into the use of binary classification evaluator methods with multi-label data.
My purpose, when I began to perform the analysis, was to see if there were any patterns in how I spent my days in comparison to how I felt (subjectively) about the day at the end.
The data was:
"recorded by myself [Jarrett], with reasonable bias, and not always in a timely manner. I had to average the [data] on many days..." [ ...] "I would also rate, on a -2 to 2 scale, how I thought the day was (-2 being the worse, 2 being the best)." [...] "I recorded 86 valid entries, and a short description of the day in the last cell (helpful for remembering why they were '2's or '-1's."
Performing a k-Nearest Neighbor analysis, as well as using logistic regression didn't yield any surprising results, and both models were ineffective in making predictions on the test data.
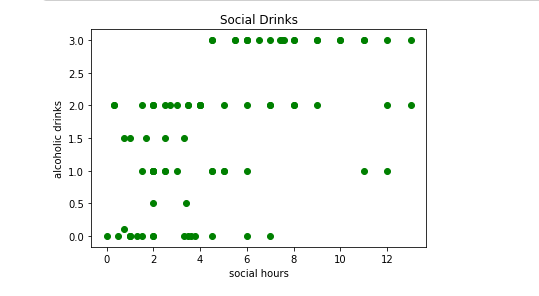
I did, however, notice some cute correlations, like the relationship between alcoholic drinks and time spent socializing.
I mentioned in the report that the most interesting findings were from the descriptive statistics. Here is a comparison between the means of my 'best days' and the full dataset.
"Best Days" Avg.Full Dataset Avg.Avg. sleep hours6.917.66Avg. creative hours0.240.67Avg. social hours9.094.82Avg. learning hours1.252.29
It leads me to wonder, how much of the increase in the rating on the 'best days' relies on the preceding 'normal' days. I would have to do some sort of time-series work to find out.
However, it's easy to hypothesize that many of the days that I spent more time learning, or writing—away from family friends—made the days that I spent many hours—with family and friends—more enjoyable.
PART TWO
I performed the evaluation on the models that I created and recorded these prediction results:
Fairly poor performance, but after pondering the way in which these numbers are created (and what the evaluations are used for) I became curious as to if I had made a mistake, or not.
The section below is pulled from the report journal on Github.
Model Evaluation (Cont.)
If someone didn't want to read about my confusion with model evaluation they could look at Model Evaluation in the documentation(3.3.2) and it clearly lists which methods can be used for binary, or both binary and multiclass.
I had thought I made a huge mistake when evaluating the models (I certainly made some kind of mistake). As I was about to discuss the findings I thought that the Jaccard index, and f1-score could only be used to evaluate binary classification. Well, my data certainly isn't binary.
I had to dig into the sklearn documentation for some answers. Here's what I found when it comes to multiclass & multilabel evaluations, starting with the definition of 'multiclass';
A classification problem consisting of more than two classes. A multiclass target may be represented as a 1-dimensional array of strings or integers. A 2d column vector of integers (i.e. a single output in multioutputterms) is also accepted. Within sckit-learn, all estimators supporting binary classification also support multiclass classification, using One-vs-Rest by default.
There's a distinction between multiclass & multilabel (althought they sound like the same thing);
Semantically, a multilabel target can be thought of as a set of labels for each sample. While not used internally, preprocessing.MultiLabelBinarizer is provided as a utility to convert from a list of sets representation to a 2d array or sparse matrix. One-hot encoding a multiclass target with preprocessing.LabelBinarizer turns it into a multilabel problem.I found two bits of information that could have given me more control of the data;
- If I felt it would have helped, let's say my labels were confusing, I could use a method to change the label to integers.
preprocessing.LabelEncoderhelps to canonicalize multiclass targets as integers. - If you wanted to see the confusion matrix for each code, the multilabel_confusion_matrix would be helpful. An example from the documentation is given below.
>>> y_true = ["cat", "ant", "cat", "cat", "ant", "bird"]
>>> y_pred = ["ant", "ant", "cat", "cat", "ant", "cat"]
>>> multilabel_confusion_matrix(y_true, y_pred,
...                             labels=["ant", "bird", "cat"])
array([[[3, 1],
        [0, 2]],

       [[5, 0],
        [1, 0]],

       [[2, 1],
        [1, 2]]])
I was trying to evaluate the predictions with jaccard index and f1-score (mainly). These evaluations are binary evaluators, BUT they can be used for multilabel & multiclass. They labels are each converted to binary scores then averaged in some way.
Within sckit-learn, all estimators supporting binary classification also support multiclass classification, using One-vs-Rest by default.
This is confusing with the jaccard index because the default average is 'binary'. So if I don't specify an average, I'm not quite sure what it's doing.
I did pass a parameter to the f1-score, but frankly, I didn't understand the effect. Below is the explanation from the documentation when it comes to binary vs. multiclass/multilabel.
3.3.2.1. From binary to multiclass and multilabel
Some metrics are essentially defined for binary classification tasks (e.g. f1_score, roc_auc_score). In these cases, by default only the positive label is evaluated, assuming by default that the positive class is labelled 1 (though this may be configurable through the pos_label parameter)...
...In extending a binary metric to multiclass or multilabel problems, the data is treated as a collection of binary problems, one for each class. There are then a number of ways to average binary metric calculations across the set of classes, each of which may be useful in some scenario. Where available, you should select among these using the average parameter.
- "macro" simply calculates the mean of the binary metrics, giving equal weight to each class. In problems where infrequent classes are nonetheless important, macro-averaging may be a means of highlighting their performance. On the other hand, the assumption that all classes are equally important is often untrue, such that macro-averaging will over-emphasize the typically low performance on an infrequent class.
- "weighted" accounts for class imbalance by computing the average of binary metrics in which each class’s score is weighted by its presence in the true data sample.
- "micro" gives each sample-class pair an equal contribution to the overall metric (except as a result of sample-weight). Rather than summing the metric per class, this sums the dividends and divisors that make up the per-class metrics to calculate an overall quotient. Micro-averaging may be preferred in multilabel settings, including multiclass classification where a majority class is to be ignored.
- "samples" applies only to multilabel problems. It does not calculate a per-class measure, instead calculating the metric over the true and predicted classes for each sample in the evaluation data, and returning their (sample_weight-weighted) average.
- Selecting average=None will return an array with the score for each class. While multiclass data is provided to the metric, like binary targets, as an array of class labels, multilabel data is specified as an indicator matrix, in which cell [i, j] has value 1 if sample i has label j and value 0 otherwise.
I would like to demonstrate these differences, side by side, now that I have provided definition for the parameters being passed.
The method described in the documentation for using jaccard is jaccard_score so I will use that instead of the jaccard_similarity_score that I used in the first place.
It also states in the documentation, in reference to the jaccard_similarity_score:
Deprecated since version 0.21: This is deprecated to be removed in 0.23, since its handling of binary and multiclass inputs was broken.
## I was using an older version of sklearn so I had to update it so I could import the right jaccard method

from sklearn.metrics import jaccard_score
In [85]:
print("Logistic Regression Jaccard Index(weighted): %.2f" % jaccard_score(y_test, yhat_LR, average='weighted'))
print("Logistic Regression Jaccard Index(macro): %.2f" % jaccard_score(y_test, yhat_LR, average='macro'))
print("Logistic Regression f1-score weighted: %.2f" % f1_score(y_test, yhat_LR, average='weighted'))
print("Logistic Regression f1-score macro: %.2f" % f1_score(y_test, yhat_LR, average='macro'))
print("Logistic Regression(saga) f1-score weighted: %.2f" % f1_score(y_test, yhat_LR_saga, average='weighted'))
print("Logistic Regression(saga) Jaccard Index(weighted): %.2f" % jaccard_score(y_test, yhat_LR_saga, average='weighted'))

print("kNN Jaccard Index(weighted): %.2f" % jaccard_score(y_test, yhat, average='weighted'))
print("kNN Jaccard Index(macro): %.2f" % jaccard_score(y_test, yhat, average='macro'))
print("kNN F1 score weighted: %.2f" % f1_score(y_test, yhat, average='weighted'))
print("kNN F1 score macro: %.2f" % f1_score(y_test, yhat, average='macro'))
Out [85]:
Logistic Regression Jaccard Index(weighted): 0.21
Logistic Regression Jaccard Index(macro): 0.16
Logistic Regression f1-score weighted: 0.33
Logistic Regression f1-score macro: 0.26
Logistic Regression(saga) f1-score weighted: 0.33
Logistic Regression(saga) Jaccard Index(weighted): 0.25
kNN Jaccard Index(weighted): 0.31
kNN Jaccard Index(macro): 0.19
kNN F1 score weighted: 0.42
kNN F1 score macro: 0.27
Here is a reminder on the difference between macro & weighted
- "macro" simply calculates the mean of the binary metrics, giving equal weight to each class. In problems where infrequent classes are nonetheless important, macro-averaging may be a means of highlighting their performance. On the other hand, the assumption that all classes are equally important is often untrue, such that macro-averaging will over-emphasize the typically low performance on an infrequent class.
- "weighted" accounts for class imbalance by computing the average of binary metrics in which each class’s score is weighted by its presence in the true data sample.
It is apparent how different my results were from before. These models would be hard pressed to beat the basic mean prediction for a given day.
## Just for fun. Here is the multilabel_confusion_matric for the kNN model prediction
from sklearn.metrics import multilabel_confusion_matrix
In [89]:
multilabel_confusion_matrix(y_test, yhat, labels=['Bad', 'O.K.', 'Good', 'Great'])
Out[89]:
array([[[16,  0],
        [ 2,  0]],

       [[10,  4],
        [ 2,  2]],

       [[ 4,  5],
        [ 2,  7]],

       [[15,  0],
        [ 3,  0]]])
The final takeaway is this;
When evaluating a classification model, some binary evaluation methods can be used for multilabel data. The multilabel data becomes binary per label. It's worth paying attention to how the returned multilabel coefficient is calculated (i.e weighted, none, macro) across the labels.
And.. make sure modules are up to date with version
Thanks for reading, and as always, I hope you found something interesting or useful in some way!